This collection of Matlab routines provides a set of metrics that can be used to analyse 3-dimensional (e.g., two spatial axes and 1 temporal axis) raster-based data. The analyses apply to categorical data that divide the space into two or more types of blobs. These metrics extend traditional patch-based analyses used in Landscape Ecology to spatiotemporal and other 3-dimensional data sets. Metrics include blob composition metrics that describe blob volume and shape complexity and configuration metrics such as contagion and spatiotemporal complexity. For more information on the metrics and their applications, please see the recommended readings listed below.

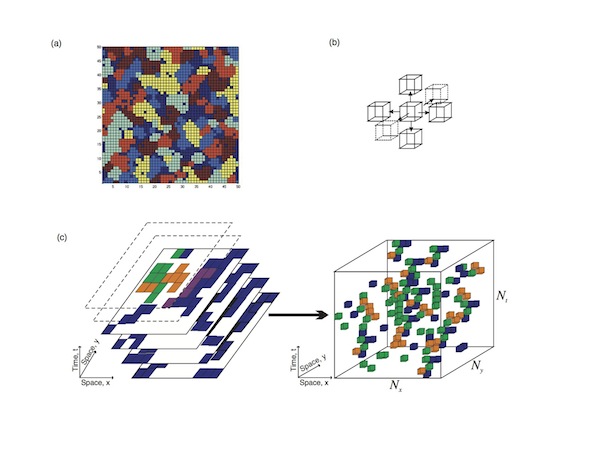
Figure 1: Format of spatiotemporal data used for the 3D metrics toolbox: (a) an example ecological mosaic composed of categorical raster data; shades of gray correspond to different categories or patch types; (b) a 3-D von Neumann neighbourhood used in the calculation of adjacencies, the Moore neighbourhood includes the 26 neighbours of a centre cell; (c) a stack of spatial mosaics taken at successive points in time can be used to generate a 3-dimensional data matrix in which spatial patches take on an additional temporal dimension to become “blobs” composed of 3D cells. (from Parrott et al., 2008)
RECOMMENDED READING
Parrott, L., Proulx, R. and Thibert-Plante, X. 2008. Three-dimensional metrics for the analysis of spatiotemporal data in ecology. Ecological Informatics, 3(6): 343-353.
Parrott, L. 2005. Quantifying the complexity of simulated spatiotemporal population dynamics. Ecological Complexity, 2(2):175-184.
DOWNLOAD
This toolbox works under all recent versions of Matlab. Some functions require the Image Analysis toolbox sold by Mathworks.
CITING THE TOOLBOX
All use of the toolbox shouldbe appropriately acknowledged. Use of the 3D metrics in an academic study (research article, report or other document) should cite: Parrott, L., Proulx, R. and Thibert-Plante, X. 2008. Three-dimensional metrics for the analysis of spatiotemporal data in ecology. Ecological Informatics, 3(6): 343-353.

3D Metrics Toolbox by Lael Parrott is licensed under a Creative Commons Attribution-NonCommercial-ShareAlike 3.0 Unported License.

