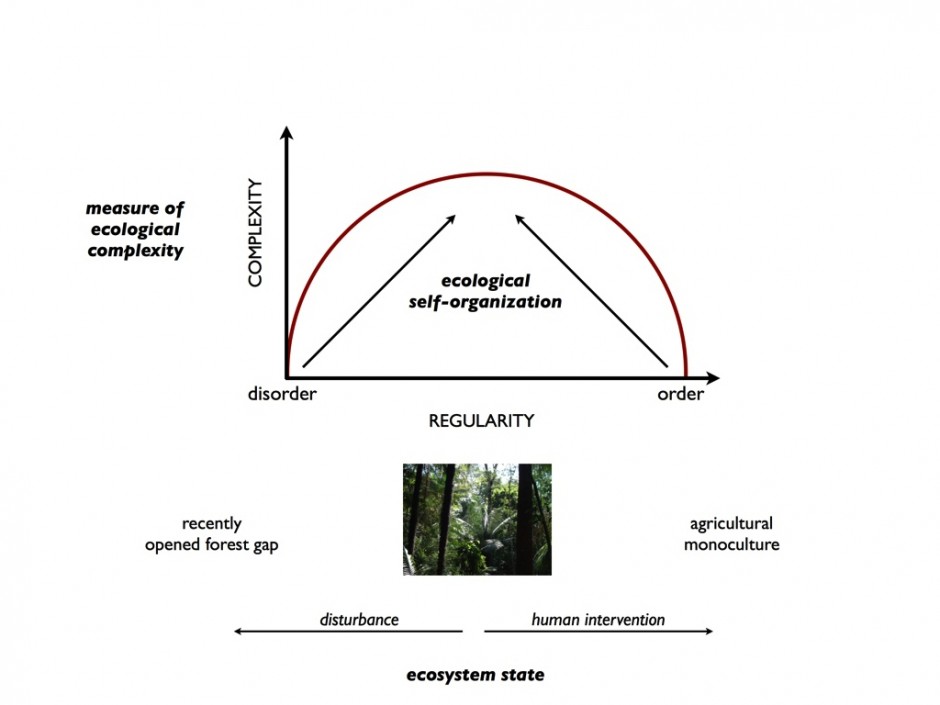
Much of our work has focused on creating metrics of complexity that can be applied to ecological data. This work is founded in information theory, and the idea that a complex system displays signals, or patterns, in time, space and its hierarchical organization, that are neither ordered nor disordered. We have argued that complexity may in fact be an ecological orientor, and that an ecosystem will develop towards a state of maximal complexity via the process of self-organisation (Parrott, L. 2010. Measuring ecological complexity. Ecological Indicators, 10:1069-1076.).

Figure 1 (reproduced from Parrott, 2010): Ecological complexity as an ecological indicator. An ecosystem tends towards greater complexity via the process of self-organization, which draws the system away from the two extremes of order and disorder to a state of maximal complexity. This state of maximal complexity is a site-specific attractor which is constrained by prevailing physical and environmental conditions. Natural disturbance events may cause an ecosystem’s state to tend towards greater disorder, whereas human intervention in the form of energy input can move the system state towards greater order than might be attainable naturally. Here, an agricultural monoculture, such as a cornfield planted in rows, serves as an analogy for an ordered ecosystem, whereas a recently opened gap in a forest, in which seeds have randomly fallen and just begun to germinate, may be an example of a disordered ecosystem. An undisturbed, ancient tropical rainforest (central image) is probably the best example of one of the Earth’s most complex ecosystems.
What is complexity?
Complexity is an attribute of a system. It is thus a measurable quantity that can be scaled to a range of 0 (for a perfectly simple system) to 1 (maximally complex). While there is no universally accepted definition of complexity, most scientists would agree that complexity is related to the minimal length of a description of the system. This definition has its origins in information theory, in which theoreticians searched for the shortest algorithm to describe or reproduce a given string of symbols (known as algorithmic complexity). Algorithmic complexity, however, is maximal for random strings of symbols and minimal for perfectly ordered symbol strings.
A system displaying perfectly periodic dynamics in space and time is thus a relatively simple system, since it’s dynamics can be easily described using a sinusoidal function. Likewise, a system displaying truly random (i.e., uniformly distributed white noise) spatiotemporal dynamics is also a simple system since this behaviour can be modelled using a probability distribution. The truly complex systems are those for which no single function exists to describe or model their dynamics. These are the systems that have spatiotemporal signals displaying patterns at all scales and thus for which a description at a given spatial or temporal resolution does not suffice. The most complex systems have signals that natural scientists know well: signals containing some apparent organisation or repeatable patterns at certain resolutions or characteristic scales, overlain by considerable “noise” or variability. The challenge in the study of complex systems is, therefore, to find ways of describing or quantifying this type of pattern.
Spatial complexity
We have applied information theoretic measures to spatial data such as photographic images and shown that there is a measurable relationship between habitat complexity, as measured in an image, and species diversity in diverse terrestrial and marine systems. See the following manuscripts for examples:
Proulx, R. and Parrott, L. 2008. Measures of structural complexity in digital images for monitoring the ecological signature of an old-growth forest ecosystem. Ecological Indicators, 8(3):270-284.
Mellin, C., Parrott, L., Andréfouët, S., Bradshaw, C., MacNeil, M. A. and Caley, M.J. 2012.Multi-scale marine biodiversity patterns inferred efficiently from habitat image processing. Ecological Applications, 22(3): 792-803.
Spatiotemporal complexity
See the 3D metrics project and downloads page for an information theoretic measure of spatiotemporal complexity that can be applied to spatiotemporal datasets.
downloads
Matlab routines to calculate spatial complexity measures (MIG, MMI, SE)
Click here to download the Matlab code used to calculate spatial Mean Information Gain, Mean Mutual Information, Shannon Entropy and other spatial complexity measures. Instructions and examples of how to use the routine are provided in the file.
Matlab routines to calculate spatiotemporal complexity (STC)
Click here to download the 3D Metrics Toolbox which contains a routine for calculating STC.

